
盲目的猜测并不是一种理想的决策方式,而是当没有更可靠的方法来支持我们的推理时的一种必要。用某种A/B测试来测试假设是避免盲目猜测和“抱最好的希望”的方法之一。
在上一篇中,我赢着头皮说了说产品管理中的数学,我坚定的认为这个主题就达到了我浅薄的数学知识范畴的天花板,这篇又要说统计,我连怎么开头都不知道。
幸运的是,我翻了翻自己的资料库,竟然找到了一篇和此主题相关的外文,于是连夜翻译,只是专业术语众多,这次翻译的多少有点差强人意,英文好的朋友可以看原文,不好的朋友凑合看,明白个意思就可以了。
这篇文章是以A/B测试为例来说明统计在产品管理中的作用的,关于A/B测试,大家可以参考这篇文章:
《A/B测试不是技术的活,其实是产品的活---说说A/B测试在产品管理中的应用》
正篇开始!
Why do I need to know A/B testing statistics?
为什么我(产品经理)需要知道A/B测试统计数据?
Statistics aren’t necessarily fun to learn. It’s probably more fun to put up a test between a red and green button and wait until your testing tool tells you one of them has beaten the other.
If this is your strategy, you’re ripe for disappointment. This approach isn’t much better than guessing. Often, it ends with a year’s worth of testing but the exact same conversion rate as when you started.
Statistics help you interpret results and make practical business decisions. A lack of understanding of A/B testing statistics can lead to errors and unreliable outcomes.
As Matt Gershoff from Conductrics said, quoting his college math professor, “How can you make cheese if you don’t know where milk comes from?”
学统计学并不一定有趣。在红色和绿色按钮之间进行测试,并等待测试工具告诉您其中一个按钮击败了另一个按钮,这可能更有趣。
如果这就是你的战略,那你就要失望了。这种方法并不比猜测好多少。通常情况下,它以一年的测试结束,但转化率与刚开始时完全相同。
统计数据可以帮助您解释结果并做出实际的业务决策。缺乏对A/B测试统计数据的理解可能会导致错误和不可靠的结果。
正如Conductrics的Matt Gershoff引用他的大学数学教授的话,“如果你不知道牛奶是从哪里来的,你怎么能做出奶酪呢?”
“So, for example, say I have two cups of coffee, and I want to know which one is hotter and by how much. First, I would measure the temperature of each coffee. Next, I would see which one has the highest temp. Finally, I would subtract the lower temp coffee from the higher to get the difference in temperature. Obvious and super simple.
Now, let’s say you want to ask, “Which place in my town has the hotter coffee, McDonald’s or Starbucks?” Well, each place makes lots of cups of coffee, so I am going to have to compare a collection of cups of coffee. Any time we have to measure and compare collections of things, we need to use statistics.”
“例如,假设我有两杯咖啡,我想知道哪一杯更热,以及热了多少。首先,我会测量每杯咖啡的温度。接下来,我要看看哪一种咖啡的温度最高,最后,我要用温度较高的咖啡减去温度较低的咖啡,得到温度差。显而易见,超级简单。
现在,假设你想问:“我们镇上哪个地方的咖啡更热,麦当劳还是星巴克?”好吧,每个地方都有很多杯咖啡,所以我要比较一组咖啡。任何时候我们需要测量和比较事物的集合,我们都需要使用统计学。”
And so it is with conversion rates. Conversion optimization is a balancing act between exploration and exploitation. It’s about balancing risk, which is a fundamental problem solved by statistics. As Ton Wesseling put it:
“Within experimenting the trade off is always between exploration and exploitation. Do you want to know the real answer, or do you just want to make a profit?”
If you are testing medicines that should stop someone from dying—and the A variant is not getting those medicines—when do you stop feeding Variant A with nothing when you see Variation B is working? During the test? After a couple of positive tests? How many people need to die before you decide to give everyone Variation B.
转化率也是如此。转换优化是勘探与开发之间的一种平衡。这是关于平衡风险,这是统计学解决的一个基本问题。正如Ton Wesseling所说:
“在实验中,总是在探索和开发之间进行权衡。你是想知道真正的答案,还是只想赚钱?”
如果你正在测试可以阻止某人死亡的药物,而A变体没有得到这些药物,那么当你看到B变体起作用时,你什么时候停止给A变体喂食?考试的时候?在几次阳性检测之后?在你决定给每个人变体B之前,你需要死多少人。
Of course running a business is less dramatic than the example, but still, you want to outgrow your competitors. You want to learn but not be fully 100% sure because that will make you too slow—not adjusting rapidly enough to user wishes.”
Knowing statistics will make you a better marketer. Learning these eight core aspects of A/B testing statistics will help you increase your conversion rates and revenue.
当然,经营一家企业没有这个例子那么戏剧化,但你仍然希望超越竞争对手。你想要学习,但不能完全100%确定,因为这会让你变得太慢——不能根据用户的愿望快速调整。”
了解统计数据会让你成为更好的营销人员。了解A/B测试统计数据的这八个核心方面将帮助你提高转化率和收益。
1. Mean, variance, and sampling
均值,方差和抽样
There are three terms you should know before we dive into the nitty-gritty of A/B testing statistics:
在我们深入A/B测试统计数据之前,你应该知道三个术语:
- Mean;
- Variance;
- Sampling.
Mean 均值
The mean is the average. For conversion rates, it’s the number of events multiplied by the probability of success (n*p).
In our coffee example, this would be the process of measuring the temperature of each cup of coffee that we sample, then dividing by the total number of cups. The average temperate should be representative of the actual average.
In online experimentation, since we can’t know the “true” conversion rate, we’re measuring the mean conversion rate of each variation.
它的意思就是平均值。对于转化率,它是事件数量乘以成功概率(n*p)。
在我们的咖啡示例中,这将是测量我们采样的每杯咖啡的温度,然后除以杯子总数的过程。平均温度应该代表实际的平均温度。
在在线实验中,由于我们无法知道“真实”转化率,所以我们只能测量每个变量的平均转化率。
Variance 方差
Variance is the average variability of our data. The higher the variability, the less precise the mean will be as a predictor of an individual data point.
It’s basically, on average, how far off individual cups of coffee are from the collection’s average temperature. In other words, how close will the mean be to each cup’s actual temperature? The smaller the variance, the more accurate the mean will be as a guess for each cup’s temperature.
Many things can cause variance (e.g. how long ago the coffee was poured, who made it, how hot the water was, etc.). In terms of conversion optimization, Marketing Experiments gives a great example of variance:
方差是数据的平均变异性。变异性越高,作为单个数据点预测的平均值就越不精确。
它基本上是指,平均而言,每杯咖啡与咖啡的平均温度相差有多远。换句话说,平均值与每个杯子的实际温度有多接近?方差越小,对每个杯子的温度的猜测就越准确。
很多事情都可能导致差异(例如,咖啡是多久前倒的,是谁做的,水有多热,等等)。在转换优化方面,《Marketing Experiments》给出了一个关于方差的好例子:

The two images above are the exact same—except that the treatment earned 15% more conversions. This is an A/A test.
A/A tests, which are often used to detect whether your testing software is working, are also used to detect natural variability. It splits traffic between two identical pages. If you discover a statistically significant lift on one variation, you need to investigate the cause.
上面的两张图片是完全一样的,除了处理多了15%的转化率。这是A/A测试。
A/A测试通常用于检测您的测试软件是否正常工作,也用于检测自然可变性。它在两个相同的页面之间分割流量。如果你发现一个变异在统计上有显著提升,你需要调查原因。
Sampling 抽样
Since we can’t measure the “true conversion rate,” we have to select a sample that’s statistically representative of the whole.
In our coffee example, we don’t know the mean temperature of coffee from each restaurant. Therefore, we need to collect data on the temperature to estimate the average temperature. So, unlike comparing individual cups of coffee, we don’t measure all possible cups of coffee from McDonald’s and Starbucks. We use some of them to estimate the total.
The more cups we measure, the more likely it is that the sample is representative of the actual temperature. The variance shrinks with a larger sample size, and it’s more likely that our mean will be accurate.
Similarly, in conversion optimization, the larger the sample size, in general, the more accurate your test will be.
因为我们无法测量“真实转化率”,所以我们必须选择一个在统计上能够代表整体的样本。
在我们的咖啡例子中,我们不知道每家餐厅咖啡的平均温度。因此,我们需要收集温度数据来估计平均温度。所以,与比较个别咖啡不同,我们不会测量麦当劳和星巴克所有可能的咖啡量。我们用其中的一些来估计总数。
我们测量的杯子越多,样品就越有可能代表实际温度。样本容量越大,方差越小,均值越有可能准确。
类似地,在转换优化中,一般来说,样本量越大,测试就越准确。
2. Statistical significance
统计显著性
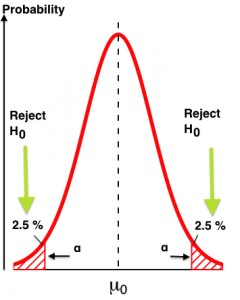
Let’s start with the obvious question: What is statistical significance? As Evan Miller explains:
When an A/B testing dashboard says there is a “95% chance of beating original” or “90% probability of statistical significance,” it’s asking the following question: Assuming there is no underlying difference between A and B, how often will we see a difference like we do in the data just by chance?
Statistical significance is a major quantifier in null-hypothesis statistical testing. Simply put, a low significance level means that there’s a big chance that your “winner” is not a real winner. Insignificant results carry a larger risk of false positives (known as Type I errors).
If you don’t predetermine a sample size for your test and a stopping point (when the test will end), you’re likely get inaccurate results. Why? Because most A/B testing tools do not wait for a fixed horizon (a set point in time) to call statistical significance.
Most A/B tests oscillate between significant and insignificant at many points throughout the experiment:
让我们从一个显而易见的问题开始:什么是统计显著性?埃文·米勒解释道:
当一个A/B测试仪表板说有“95%的概率击败原始数据”或“90%的概率具有统计显著性”时,它会问以下问题:假设A和B之间没有潜在的差异,我们有多少次会像在数据中偶然看到的那样看到差异?
统计显著性是零假设统计检验的主要量词。简单地说,低显著性水平意味着你的“赢家”很有可能不是真正的赢家。不重要的结果具有较大的假阳性风险(称为I型错误)。
如果您没有预先确定测试的样本量和停止点(测试结束的时间),您可能会得到不准确的结果。为什么?因为大多数A/B测试工具不会等待一个固定的范围(一个时间设置点)来调用统计显著性。
大多数A/B测试在整个实验的许多点上都在显著和不显著之间振荡:
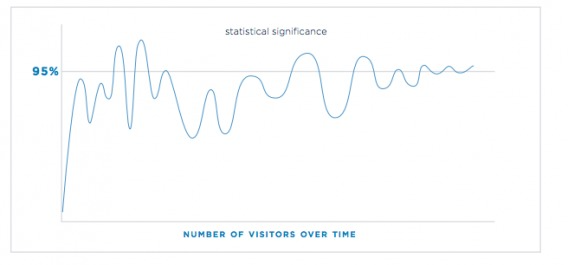
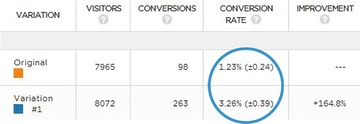
That’s one of the big reasons why statistical significance is not a stopping rule. The biggest mistake beginning optimizers make is calling their tests early.
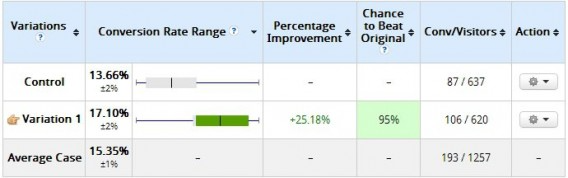
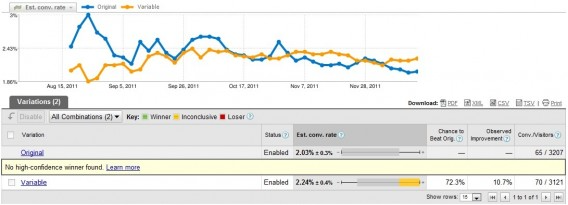
Here’s an example we’ve given before. Two days after a test started, here were the results:
这就是为什么统计显著性不是终止规则的重要原因之一。初始优化人员犯的最大错误是过早调用测试。
这是我们之前举过的一个例子。测试开始两天后,结果如下:
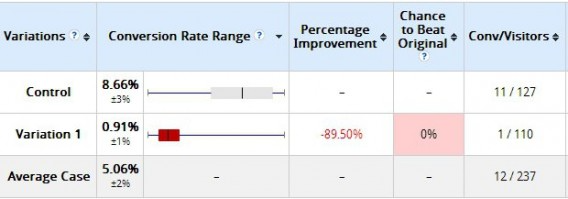
The variation clearly lost, right? It had a 0% chance to beat the original. Not so fast. Was it “statistically significant” according to the tool? Yes. But check out the results 10 days later:
变量显然消失了,对吧?它打败原版的几率为0%没那么快。根据该工具,它是否具有“统计学意义”?是的。但看看10天后的结果:
That’s why you shouldn’t peek at results. The more you peek at the results, the more you risk what’s called “alpha error inflation”. Set a sample size and a fixed horizon, and don’t stop the test until then.
Also, be wary of case studies that claim statistical significance yet don’t publish full numbers. Many may be “statistically significant” but have a tiny sample size (e.g. 100 users).
这就是为什么你不应该偷看结果。你对结果看得越多,就越有可能出现所谓的“alpha误差膨胀”。设定一个样本大小和固定的范围,在此之前不要停止测试。
此外,要警惕那些声称有统计学意义但没有公布完整数字的案例研究。许多可能具有“统计学意义”,但样本规模很小(例如100个用户)。
3. P-values
P值
If you do some follow-up reading on statistical significance, you’ll likely come across the term “p-value.” The p-value is a measure of evidence against the null hypothesis (the control in A/B testing parlance).
Matt Gershoff gave a great example and explanation in a previous article:
如果你做一些关于统计显著性的后续阅读,你可能会遇到“p值”这个术语。p值是针对零假设(A/B测试术语中的控制)的证据度量。
Matt Gershoff在之前的文章中给出了一个很好的例子和解释:
“If we go out and offer 50 prospects our ‘Analytics200’ promotion, we would expect, on average, to have 5 conference signups. However, we wouldn’t really be that surprised if we saw a few less or a few more.
But what is a few? Would we be surprised if we saw 4? What about 10, or 25, or zero? It turns out that the p-value answers the question, “How surprising is this result?”
Formally, the p-value is the probability of seeing a particular result (or greater one) from zero, assuming that the null hypothesis is true. If “null hypothesis is true” is confusing, replace it with, “assuming we had really run an A/A test.”
If our test statistic is in the “surprising” region, we reject the null (reject that it was really an A/A test). If the result is within the “not surprising” area, then we fail to reject the null. That’s it.
“如果我们向50个潜在客户提供‘Analytics200’促销活动,我们预计平均会有5个会议注册。然而,如果我们看到的少一些或多一些,我们真的不会感到惊讶。
但什么是少数呢?如果我们看到4个,我们会惊讶吗?10个,25个,0个呢?结果证明p值回答了一个问题,“这个结果有多令人惊讶?”
形式上,p值是在零假设成立的情况下,从零看到特定结果(或更大结果)的概率。如果“零假设为真”让人困惑,那就把它换成“假设我们真的进行了A/A测试”。
如果我们的测试统计量在“令人惊讶”的区域,我们拒绝null(拒绝它实际上是A/A测试)。如果结果在“不令人惊讶”的区域内,那么我们就不能拒绝null。就是这样。
What you actually need to know about P-Values
关于p值你真正需要知道的
The p-value does not tell you the probability that B is better than A. Similarly, it doesn’t tell you the probability that you’ll make a mistake if you implement B instead of A. These are common misconceptions.
Remember, the p-value is just the probability of seeing a result (or more extreme one) given that the null hypothesis is true. Or, “How surprising is this result?”
p值并不能告诉你B优于A的概率,同样,它也不能告诉你如果你执行B而不是A,你会犯错误的概率。这些都是常见的误解。
记住,p值只是在零假设为真的情况下看到结果(或更极端的结果)的概率。或者,“这个结果有多令人惊讶?”
Small note: There’s a large debate in the scientific community about p-values. This comes primarily from the controversial practice of “p-hacking” to manipulate the results of an experiment until it reaches significance (so the author can get published).
小提示:科学界对p值有很大的争论。这主要来自有争议的“p-hacking”实践,即操纵实验结果,直到它达到重要意义(这样作者就可以发表论文)。
4. Statistical Power
统计功效
While statistical significance is the term you’ll hear most often, many people forget about statistical power. While significance is the probability of seeing an effect when none exists, power is the probability of seeing an effect when it does actually exist—the sensitivity of your test.
When you have low power levels, there’s a bigger chance that you’ll “miss” a real winner. Evan Miller put together a great chart to explain the differences:
虽然统计显著性是你最常听到的术语,但许多人忘记了统计功效。显著性是指在不存在的情况下发现某种效应的概率,而功效则是指在确实存在的情况下发现某种效应的概率——也就是测试的灵敏度。
当你的能量水平较低时,你很有可能“错过”一个真正的赢家。埃文·米勒(Evan Miller)整理了一张很棒的图表来解释这些差异:
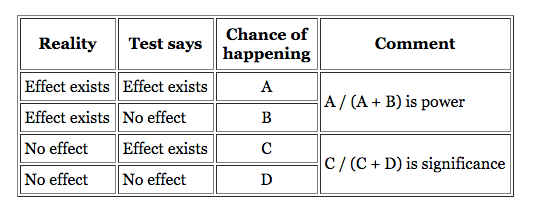
Statistical power is the likelihood that a study will detect an effect when there is an effect there to be detected. If statistical power is high, the probability of making a Type II error, or concluding there is no effect when, in fact, there is one, goes down.
统计功效是指当一项研究存在一种效应需要被检测时,该研究能够检测到这种效应的可能性。如果统计功效很高,那么出现第二类错误的概率就会下降,或者在事实上存在影响的情况下得出没有影响的结论的概率就会下降。
Four main factors affect the power of any test for statistical significance:
- Effect size;
- Sample size (n);
- Alpha significance criterion (α);
- Statistical power, or the chosen or implied beta (β).
四个主要因素影响任何统计显著性检验的效力:
影响规模;
样本量(n);
α显著性准则(α);
统计功效,或选择或隐含贝塔(β)。
For practical purposes, all you really need to know is that 80% power is the standard for testing tools. To reach that level, you need either a large sample size, a large effect size, or a longer duration test.
出于实际目的,您真正需要知道的是测试工具的标准功率为80%。为了达到这个水平,你需要一个大的样本量,一个大的效应量,或者一个更长的持续时间测试。
“You want to test as long as possible—at least one purchase cycle—the more data, the higher the statistical power of your test! More traffic means you have a higher chance of recognizing your winner on the significance level you’re testing on!
Because…small changes can make a big impact, but big impacts don’t happen too often. Most of the time, your variation is slightly better—so you need enough data to be able to notice a significant winner.”
One caveat: If your test lasts too long, you risk sample pollution.
“你希望测试的时间越长越好——至少一个购买周期——数据越多,你的测试的统计能力就越强!更多的流量意味着你有更高的机会在测试的显著性水平上识别出你的赢家!
因为……小的改变可以产生大的影响,但大的影响并不经常发生。大多数时候,你的变化会稍微好一点,所以你需要足够的数据来发现一个重要的赢家。”
警告:如果你的测试持续时间过长,你可能会面临样本污染的风险。
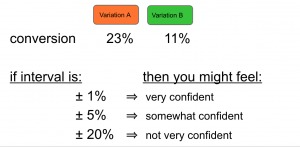
5. Confidence intervals and margin of errors
置信区间和误差范围
Confidence intervals are the amount of error allowed in an A/B test—a measure of the reliability of an estimate. Here’s an example from PRWD:
置信区间是A/B测试中允许的误差量——衡量估计的可靠性。以下是来自PRWD的一个例子:
Since statistics is inferential, we use confidence intervals to mitigate the risk of sampling errors. In that sense, we’re managing the risk associated with implementing a new variation. So if your tool says something like, “We are 95% confident that the conversion rate is X% +/- Y%,” then you need to account for the +/- Y% as the margin of error.
One practical application is to watch if confidence intervals overlap. As Michael Aagaard puts it:
由于统计是推理的,我们使用置信区间来降低抽样错误的风险。从这个意义上说,我们正在管理与实现新变体相关的风险。因此,如果你的工具说,“我们有95%的信心,转化率是X% +/- Y%”,那么你需要考虑+/- Y%作为误差范围。
一个实际应用是观察置信区间是否重叠。正如Michael Aagaard所言:
So, the conversion range can be described as the margin of error you’re willing to accept. The smaller the conversion range, the more accurate your results will be. As a rule of thumb, if the two conversion ranges overlap, you’ll need to keep testing in order to get a valid result.
因此,转换范围可以描述为您愿意接受的误差范围。转换范围越小,结果就越准确。根据经验,如果两个转换范围重叠,则需要继续测试以获得有效的结果。
John Quarto has a great visual explaining confidence intervals:
John Quarto针对置信区间有一个很好的可视化解释:
Confidence intervals shrink as you collect more data, but at a certain point, there’s a law of diminishing returns.
当你收集更多的数据时,置信区间会缩小,但在某一点上,有一个递减的规律。
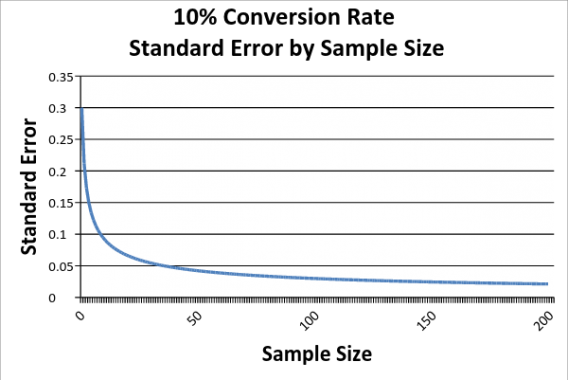
Reading right to left, as we increase our sample size, our sampling error falls. However, it falls at a decreasing rate, which means that we get less and less information from each addition to our sample.
Now, if you were to do further research on the subject, you might be confused by the interchangeability of the terms “confidence interval” and “margin of error”. For all practical purposes, here’s the difference: The confidence interval is what you see on your testing tool as “20% +/- 2%,” and the margin of error is “+/- 2%.”
Matt Gershoff gave an illustrative example:
从右向左看,样本量越大,抽样误差就越小。然而,它以递减的速度下降,这意味着我们从样本中的每一项添加中得到的信息越来越少。
现在,如果你对这个主题做进一步的研究,你可能会对“置信区间”和“误差幅度”这两个术语的可互换性感到困惑。出于所有实际目的,区别在于:置信区间是您在测试工具上看到的“20% +/- 2%”,而误差范围是“+/- 2%”。
Matt Gershoff举了一个例子:
“Say your buddy is coming to visit you from Round Rock and is taking TX-1 at 5 p.m. She wants to know how long it should take her. You say I have 95% confidence that it will take you about 60 minutes, plus or minus 20 minutes. So your margin of error is 20 minutes, or 33%.
If she is coming at 11 a.m., you might say, “It will take you 40 minutes, plus or minus 10 minutes,” so the margin of error is 10 minutes, or 25%. While both are at the 95% confidence level, the margin of error is different.”
“假设你的朋友下午5点从Round Rock来看你,并乘坐TX-1。她想知道需要多长时间。你说我有95%的信心,这将花费你大约60分钟,正负20分钟。误差范围是20分钟,也就是33%
如果她上午11点来,你可能会说,“这将花费你40分钟,正负10分钟,”所以误差范围是10分钟,或25%。虽然两者都处于95%的置信水平,但误差范围是不同的。”
6. Regression to the mean
均值回归
A common question one might have when first testing is, “What is the reason for the wild fluctuations at the beginning of the test?” Here’s what I mean:
第一次测试时可能会遇到的一个常见问题是,“测试开始时剧烈波动的原因是什么?”我的意思是:
What’s happening is a regression to the mean. A regression to the mean is “the phenomenon that if a variable is extreme on its first measurement, it will tend to be closer to the average on its second measurement.”
A great example comes from Wikipedia:
正在发生的是向均值的回归。回归均值是指“如果一个变量在第一次测量时是极端的,那么它在第二次测量时就倾向于接近平均值的现象。”
维基百科上有一个很好的例子:
Imagine you give a class of students a 100-item true/false test on a subject. Suppose all the students choose their answers randomly. Then, each student’s score would be a realization of independent and identically distributed random variables, with an expected mean of 50. Of course, some students would score much above 50 and some much below.So say you take only the top 10% of students and give them a second test where they, again, guess randomly on all questions. Since the mean would still be expected to be near 50, it’s expected that the students’ scores would regress to the mean—their scores would go down and be closer to the mean.
想象一下,你给一个班级的学生做一项100道题的真假测试。假设所有的学生都是随机选择答案。然后,每个学生的分数将是独立和同分布随机变量的实现,期望平均值为50。当然,有些学生的分数远高于50分,有些则远低于50分。假设你只选出前10%的学生,让他们做第二次测试,所有问题都是随机猜的。由于平均水平仍将接近50,因此学生的分数将回归到平均水平——他们的分数将下降并更接近平均水平。
In A/B testing, it can happen for a variety of reasons. If you’re calling a test early based only on reaching significance, it’s possible that you’re seeing a false positive. And it’s likely that your “winner” will regress to the mean.
A related topic is the novelty effect. That’s when the novelty of your changes (e.g. bigger blue button) brings more attention to the variation. With time, the lift disappears because the change is no longer novel.
Adobe outlined a method to distinguish the difference between a novelty effect and actual inferiority:
在A/B测试中,出现这种情况的原因多种多样。如果您只是基于达到显著性而提前进行测试,那么您可能会看到假阳性。你的“赢家”很可能会回归到均值。
一个相关的话题是新颖性效应。这是当你的变化的新颖性(例如更大的蓝色按钮)带来更多的关注变化。随着时间的推移,这种提升消失了,因为这种变化不再新奇。
Adobe概述了一种区分新奇效果和实际低劣效果的方法:
To determine if the new offer underperforms because of a novelty effect or because it’s truly inferior, you can segment your visitors into new and returning visitors and compare the conversion rates. If it’s just the novelty effect, the new offer will win with new visitors. Eventually, as returning visitors get accustomed to the new changes, the offer will win with them, too.
为了确定新产品的表现不佳是因为新奇效应还是因为它真的很差,你可以将访问者分为新访问者和回头客,并比较转化率。如果仅仅是新奇效应,那么新优惠将赢得新访客。最终,随着回头客逐渐适应新变化,这个优惠也会赢得他们的青睐。
7. Segmenting
分段
The key to learning in A/B testing is segmenting. Even though B might lose to A in the overall results, B might beat A in certain segments (e.g. organic, Facebook, mobile, etc). For segments, the same stopping rules apply.
Make sure that you have a large-enough sample size within each segment. Calculate it in advance; be wary if it’s less than 250–350 conversions per variation within each segment.
As André Morys said in a previous article, searching for lifts within segments that have no statistical validity is a big mistake:
在A/B测试中学习的关键是分段。尽管B可能在整体结果上输给A,但B可能在某些领域(如有机、Facebook、移动等)击败A。对于分段,同样的停止规则也适用。
确保每个分段的样本量足够大。提前计算;如果每个分段的每个变量的转换量低于250-350,就要小心了。
正如André Morys在之前的一篇文章中所说,在没有统计有效性的细分市场中搜索提升是一个很大的错误:
“We just ran a test for a big fashion retailer in the middle of the summer sale phase. It was very interesting to see how the results dramatically dropped during the ‘hard sale phase’ with 70% and more—but it recovered one week after the phase ended. We would never have learned this if the test hadn’t run for nearly four weeks.
Our ‘rule of thumb’ is this: 3,000–4,000 conversions per variation and a 3–4 week test duration. That is enough traffic so we can even talk about valid data if we drill down into segments.
Testing ‘sin’ no. 1: searching for uplifts within segments although you have no statistical validity—e.g. 85 vs. 97 conversions—that’s bullshit.”
You can learn a lot from segmenting your test data, but make sure you’re applying the same statistical rules to smaller data sets.
“我们刚刚为一家大型时装零售商在夏季促销阶段进行了一次测试。有趣的是,在“硬性销售阶段”,结果急剧下降,达到70%甚至更多,但在该阶段结束一周后又恢复了。如果测试没有进行近四周,我们永远也不会知道这一点。
我们的“经验法则”是:每个变量有3000 - 4000次转换,测试持续时间为3-4周。这是足够的流量,所以我们甚至可以讨论有效的数据,如果我们深入到段。
Testing ‘sin’ no. 1:在分段内搜索提升,尽管你没有统计有效性。85次vs. 97次——这是扯淡。”
您可以从划分测试数据中学到很多东西,但是要确保您对较小的数据集应用相同的统计规则。
8. Confounding variables and external factors
混淆变量和外部因素
There’s a challenge with running A/B tests: The data is “non-stationary.”
运行A /B测试存在一个挑战:数据是“非平稳的”。
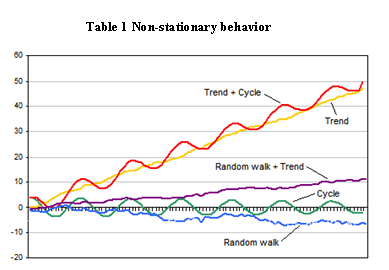
A stationary time series is one whose statistical properties (mean, variance, autocorrelation, etc.) are constant over time.
For many reasons, website data is non-stationary, which means we can’t make the same assumptions as with stationary data. Here are a few reasons data might fluctuate:
- Season;
- Day of the week;
- Holidays;
- Press (positive or negative);
- PPC/SEM;
- SEO;
- Word-of-mouth.
There are many more, most of which reinforce the importance of testing for full weeks. You can see this for yourself. Run a conversions per Day of Week report on your site to see how much fluctuation there is:
平稳时间序列是一个统计属性(均值、方差、自相关等)随时间不变的序列。
由于许多原因,网站数据是非平稳的,这意味着我们不能做出与平稳数据相同的假设。以下是数据可能波动的几个原因:
季节;
星期几;
假期;
Press (positive or negative);
PPC /SEM;
搜索引擎优化;
口碑。
还有很多,其中大多数都强调了测试一整周的重要性。你可以自己看看。在你的网站上运行一周每天的转化率报告,看看有多少波动:
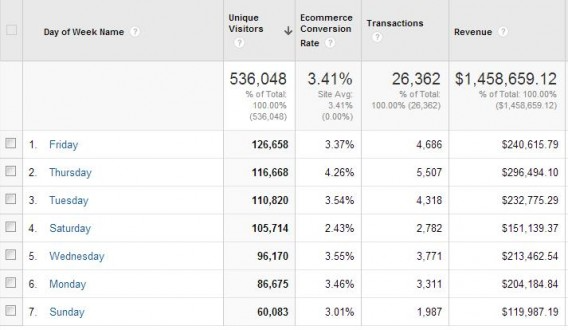
You can see that Saturday’s conversion rate is much lower than Thursday’s. So if you started the test on a Friday and ended on a Sunday, you’d skew your results.
If you’re running a test during Christmas, your winning test might not be a winner by the time February comes. Again, this is product of web data being nonstationary. The fix? If you have tests that win over the holidays (or during promotions), run repeat tests during “normal” times.
External factors definitely affect test results. When in doubt, run a follow-up test (or look into bandit tests for short promotions).
你可以看到周六的转化率比周四低得多。所以如果你在周五开始测试,在周日结束,你的结果就会扭曲。
如果您在圣诞节期间进行测试,那么到2月来的时候,您获胜的测试可能还不是获胜者。同样,这是网络数据非平稳的产物。这是固定的吗?如果您的测试在假日期间(或促销期间)胜出,请在“正常”时间运行重复测试。
外部因素肯定会影响测试结果。如果有疑问,可以进行后续测试(或针对短期促销进行强盗测试)。
Conclusion
结论
Learning the underlying A/B testing statistics allows you to avoid mistakes in test planning, execution, and interpretation. Here are some testing heuristics:
- Test for full weeks.
- Test for two business cycles.
- Make sure your sample size is large enough (use a calculator before you start the test).
- Keep in mind confounding variables and external factors (holidays, etc.).
- Set a fixed horizon and sample size for your test before you run it.
- You can’t “see a trend.” Regression to the mean will occur. Wait until the test ends to call it.
学习底层的A/B测试统计数据可以让您避免在测试计划、执行和解释中出现错误。以下是一些测试启发式方法:
测试整整几周。
测试两个商业周期。
确保你的样本量足够大(在开始测试前使用计算器)。
记住混淆变量和外部因素(假期等)。
在运行测试之前,为测试设置一个固定的范围和样本量。
你不能“看到趋势”。回归到平均水平将会发生。等到测试结束再调用它。
翻译到此结束,看懂看不懂的就这么着吧!
- 本文固定链接: http://chinapm.com.cn/index.php/post/331.html
- 转载请注明: 汤圆 于 产品经理之家 | 面向全行业产品管理者的知识干货分享平台 发表
《本文》有 0 条评论